Hothouse 9 | The Hidden Side of Digital Animation in 4 Geeky Graphs
Hothouse 9 | The Hidden Side of Digital Animation in 4 Geeky Graphs
The following is a guest post written by Kyler Kelly, one of the current participants in the NFB’s Hothouse program, a 12-week apprenticeship in animation filmmaking at the NFB.
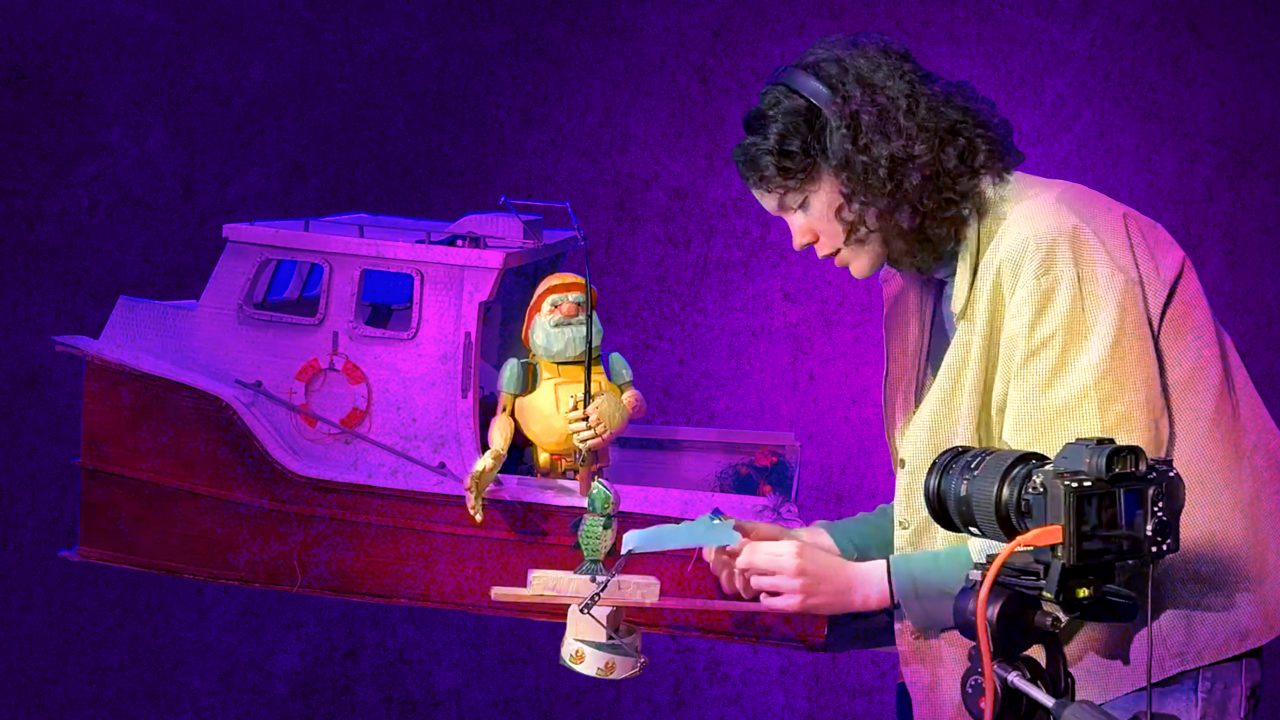
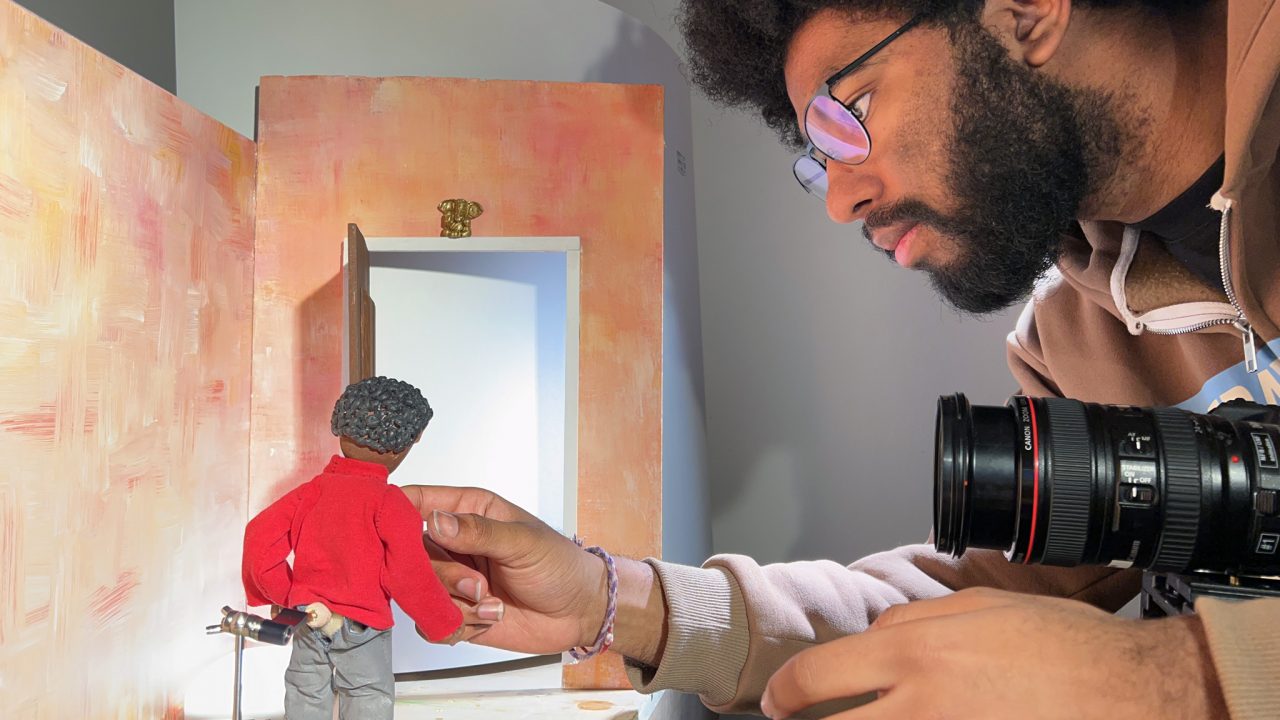
Making animation has changed a lot since the days of film. Now, the whole process is digital and takes place inside computers while using a wide range of software. For four of us here in the Hothouse program (Brendan Matkin, Shahid Quadri, Paloma Dawkins and me—Kyler Kelly), our work environment looks pretty much like any office. If it weren’t for the Cintiq drawing tablets and Paloma’s decorative Christmas lights, you might mistake us for programmers or accountants (probably only me because I currently have an Excel document open). Our other colleagues, however—Su-An Ng and Jenna Marks—occupy cozy little studios filled with art and clay everywhere. In these spaces, there are physical manifestations of the creative process of making “art”.
But for those of us working in the digital realm, the creative process lives on the NFB server in enormous strings of ones and zeros written onto hard disks that are whizzing away. So, I did the nerdiest thing ever and recorded some stats about our digital files, and I’ve compiled the data into some charts to attempt to reveal the hidden digital side of our creative process.
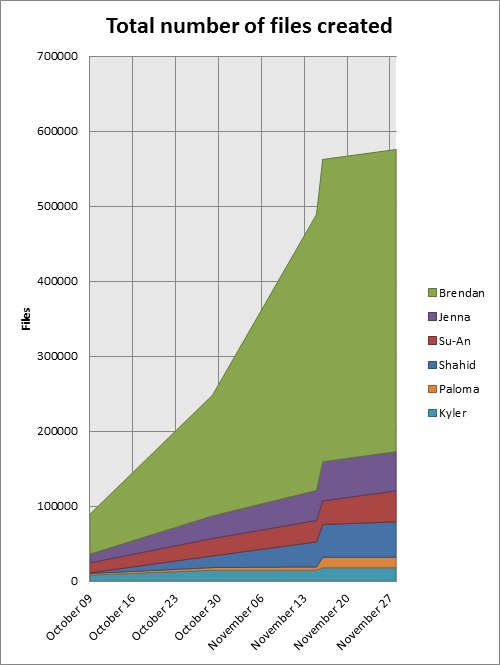
The chart above shows the total number of files we accumulated during our time in the Hothouse program. Each colour represents the portion of files that we individually created. As you can see, together we made over 575,656 files in our time at Hothouse. Due to Brendan’s working process, in which he uses programming to algorithmically generate images, he created a huge number of files. But if you look at the next chart, you can see that each of Brendan’s files is actually quite small.
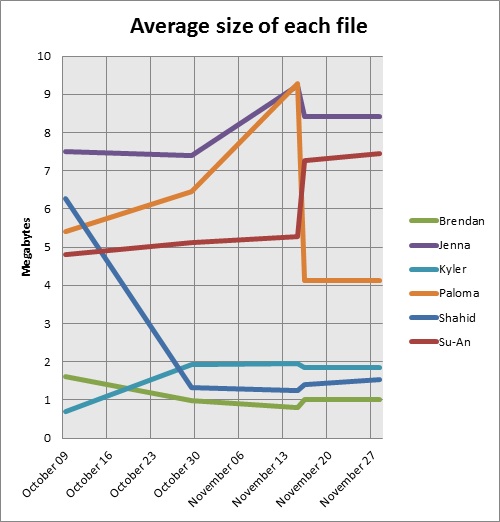
Jenna and Su-An likely have large average file sizes because they worked with digital SLR cameras that shoot large raw-format still images, each of which take up a lot of space. Brendan’s, Shahid’s and my films are all abstract films set on top of a black background, which results in relatively small and compressible image files. Paloma’s film, filled with hand-drawn fractals, landed somewhere in the middle of those two extremes.
All together, we used 1,322 gigabytes of data. That’s 11,355,900,000,000 ones and zeroes! The graph below shows the breakdown:

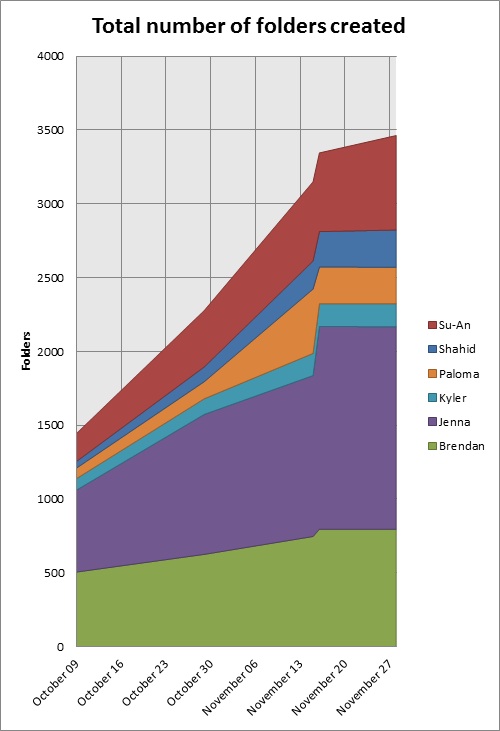
And, finally, we organized all of that data into 3,463 folders. This stuff is complicated business.
While these charts still don’t really express the true depth, complexity and artistry that goes into creating animation in the digital realm, hopefully they do provide some insight into the scale of the data and effort hidden behind the finished products you see.